


Rows, columns and products
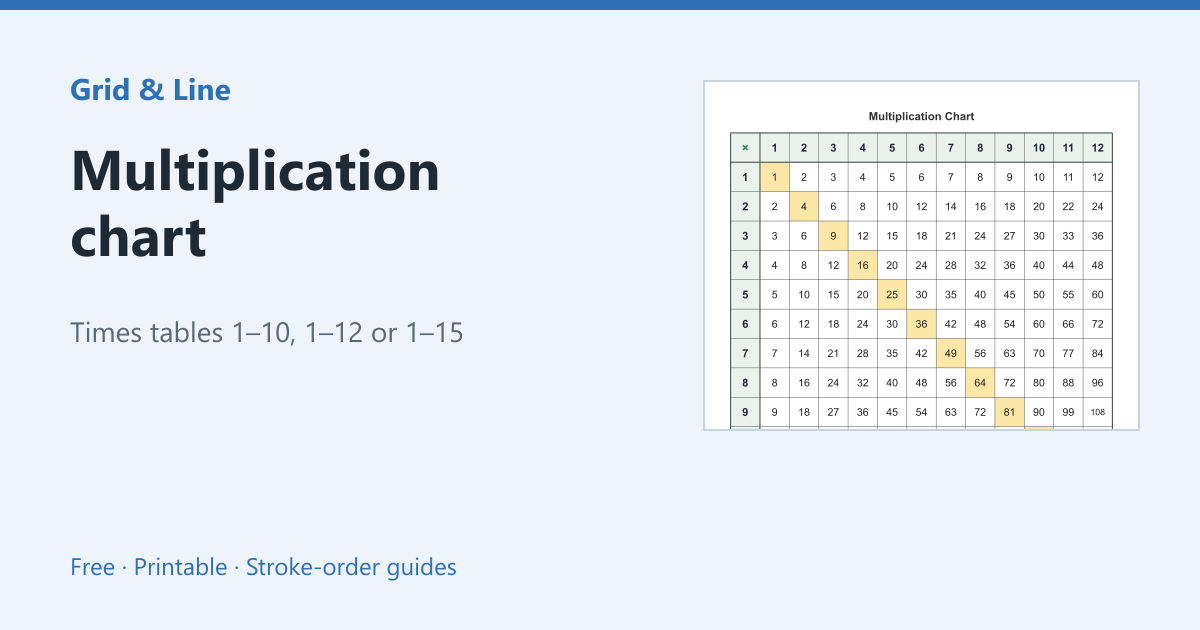
The top row and left column list the factors. Each cell shows their product. To find 7 × 8, follow the 7 row to the 8 column; the cell reads 56. Because multiplication is commutative, the chart is symmetric across the diagonal.
Patterns worth pointing out
- The 2 row is even numbers; the 5 row ends in 0 or 5.
- The 9 row’s digits add to 9 (up to 9 × 10).
- The diagonal 1, 4, 9, 16… is the square numbers.
- Every row and column increases by its factor.
Filled, blank or practice
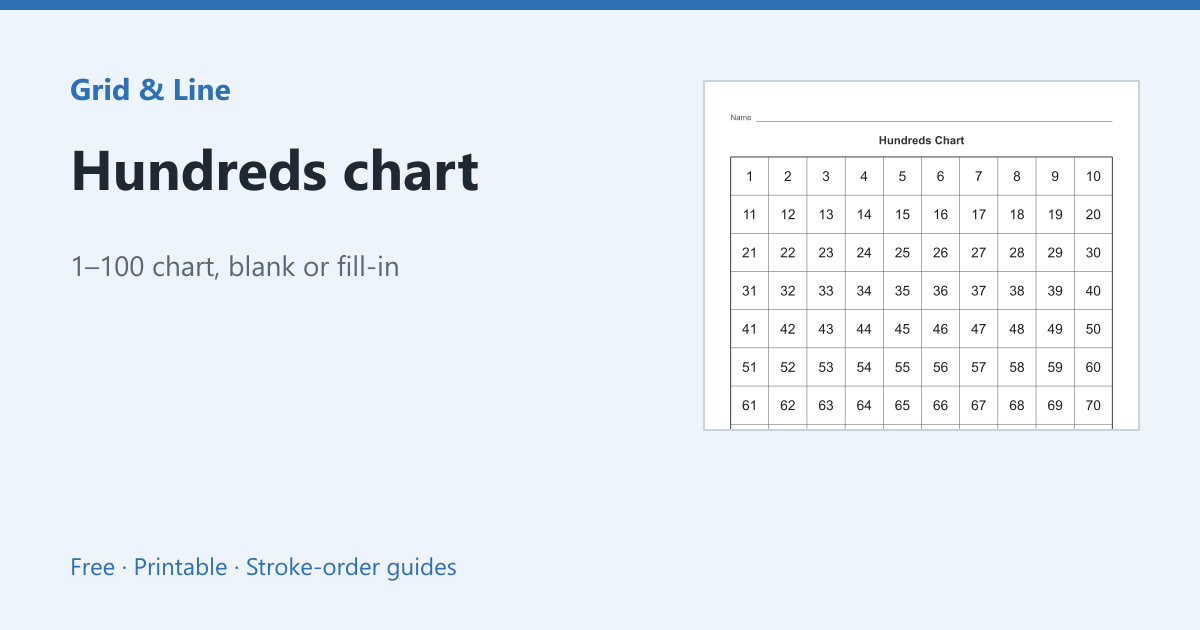
A filled chart is a reference; a blank chart is a test; a partially filled chart is a puzzle. The multiplication chart generator prints all three and lets you choose 1–10, 1–12 or 1–15. Pair it with a hundreds chart for counting patterns.
In practice
A third grader knows the 2, 5 and 10 tables but freezes on 7 × 8. The chart shows the 7 row and 8 column meeting at 56, and the commutative property means 8 × 7 is the same cell. Covering the answer turns the chart into a self-check.
Common mistakes
| Problem | Usually because | What to do |
|---|---|---|
| Row and column are swapped | The chart is read from the wrong edge | Trace both factors to the meeting cell |
| The chart becomes a crutch | It is always visible during practice | Cover the answer, then remove the chart |
| The blank chart is overwhelming | All cells are empty | Start with a partially filled chart |
 Multiplication chart
 Hundreds chart
 Place value chart