


How the chart is organised
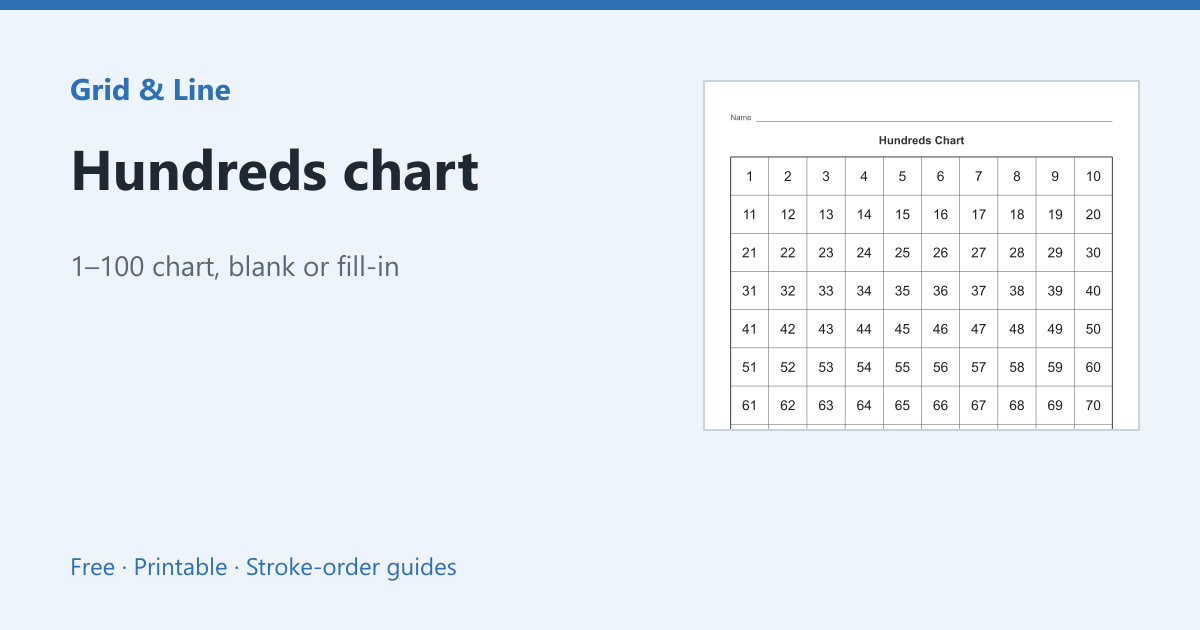
A hundreds chart has ten columns and ten rows. Reading left to right adds one; reading down adds ten. That is why the first row is 1–10, the second is 11–20, and the last is 91–100. The ones digit repeats in each column.
Classroom uses
- Counting: point to each number and count aloud.
- Skip counting: colour 2, 4, 6… or 5, 10, 15… to reveal the pattern.
- Place value: find 34 and describe it as 3 tens and 4 ones.
- Addition and subtraction: move right to add one, down to add ten.
- Missing numbers: use a blank chart and fill in the gaps.
Filled, blank or partial
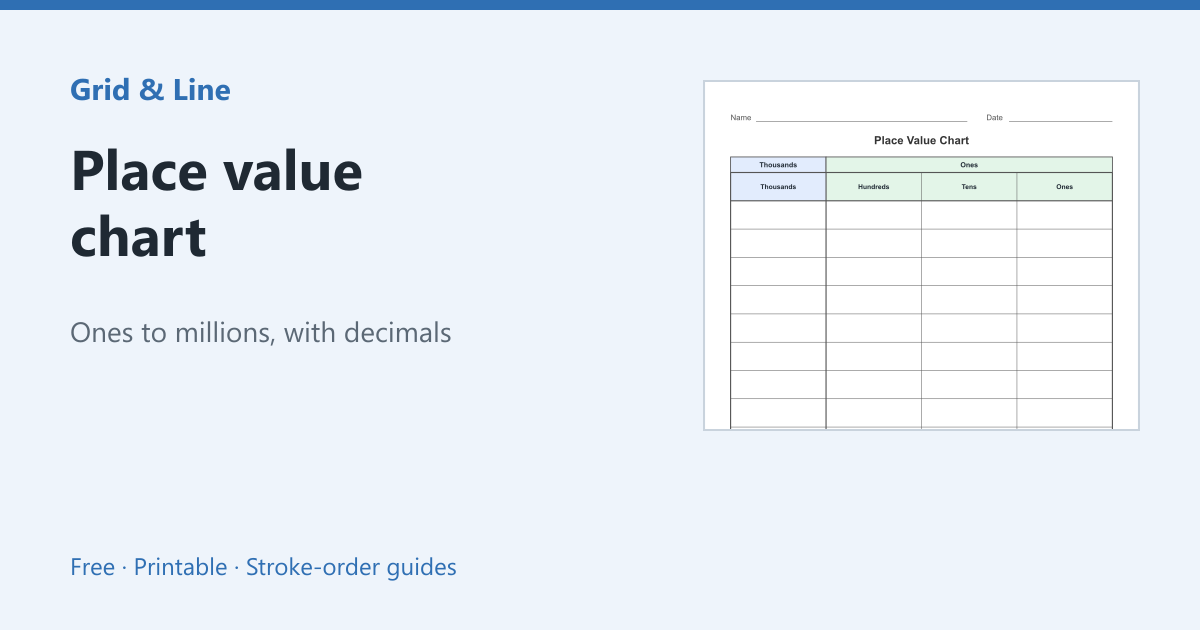
A filled chart is a reference; a blank chart is a worksheet; a partially filled chart is a puzzle. The hundreds chart generator prints all three, with options for tracing and skipping numbers. Pair it with a place value chart for tens and ones.
In practice
A first grader counts 28, 29, 40. The hundreds chart shows that after 29 comes 30, directly below the 20s row. Pointing to the row change while counting makes the decade transition visible.
Common mistakes
| Problem | Usually because | What to do |
|---|---|---|
| Counting jumps after 29 | The decade row is not understood | Trace the row change with a finger |
| Skip counting goes sideways | Counting by tens across a row | Move down one row for each ten |
| The blank chart is too hard | Too many missing numbers | Start with a partially filled chart |
 Hundreds chart
 Multiplication chart
 Place value chart